Qualtrics Mouse Tracking
A how-to guide for fast implementation
Over the past few years I have received many requests for direction on how to implement a mouse tracking system for Qualtrics that I wrote a couple years back for a psychology researcher at Virginia Tech. Instead of responding to individual emails, I've decided to post the code publicly along with a short tutorial. Feel free to use the code freely and share with anyone who may be interested.
UPDATE: The code has found many uses, especially and to my knowledge exclusively for researchers. The code has been extended and implemented by Maya B. Mathur and David B. Reichling and is available through Springer: https://link.springer.com/article/10.3758/s13428-019-01258-6
Implementation
As far as I know, Qualtrics does not have a built in way to store & retrieve mouse tracking data. It is, however, quite flexible and allows users to insert javascript and HTML into any question. Using some javascript, the user's mouse position can be recorded at a given frequency, say once every 10ms. Although it is a bit of a hack, we can then use Qualtrics' embedded data variables to store the mouse position and time data. This data can easily be retrieved in Qualtrics using the 'View Results' tab.
There are just three steps to getting things up and running: Create the embedded data variables, insert the mouse tracking code, and configure the 'Next Button'.
- Create Embedded Data Variables
- Insert mouse tracking Code
- Configure Next Button
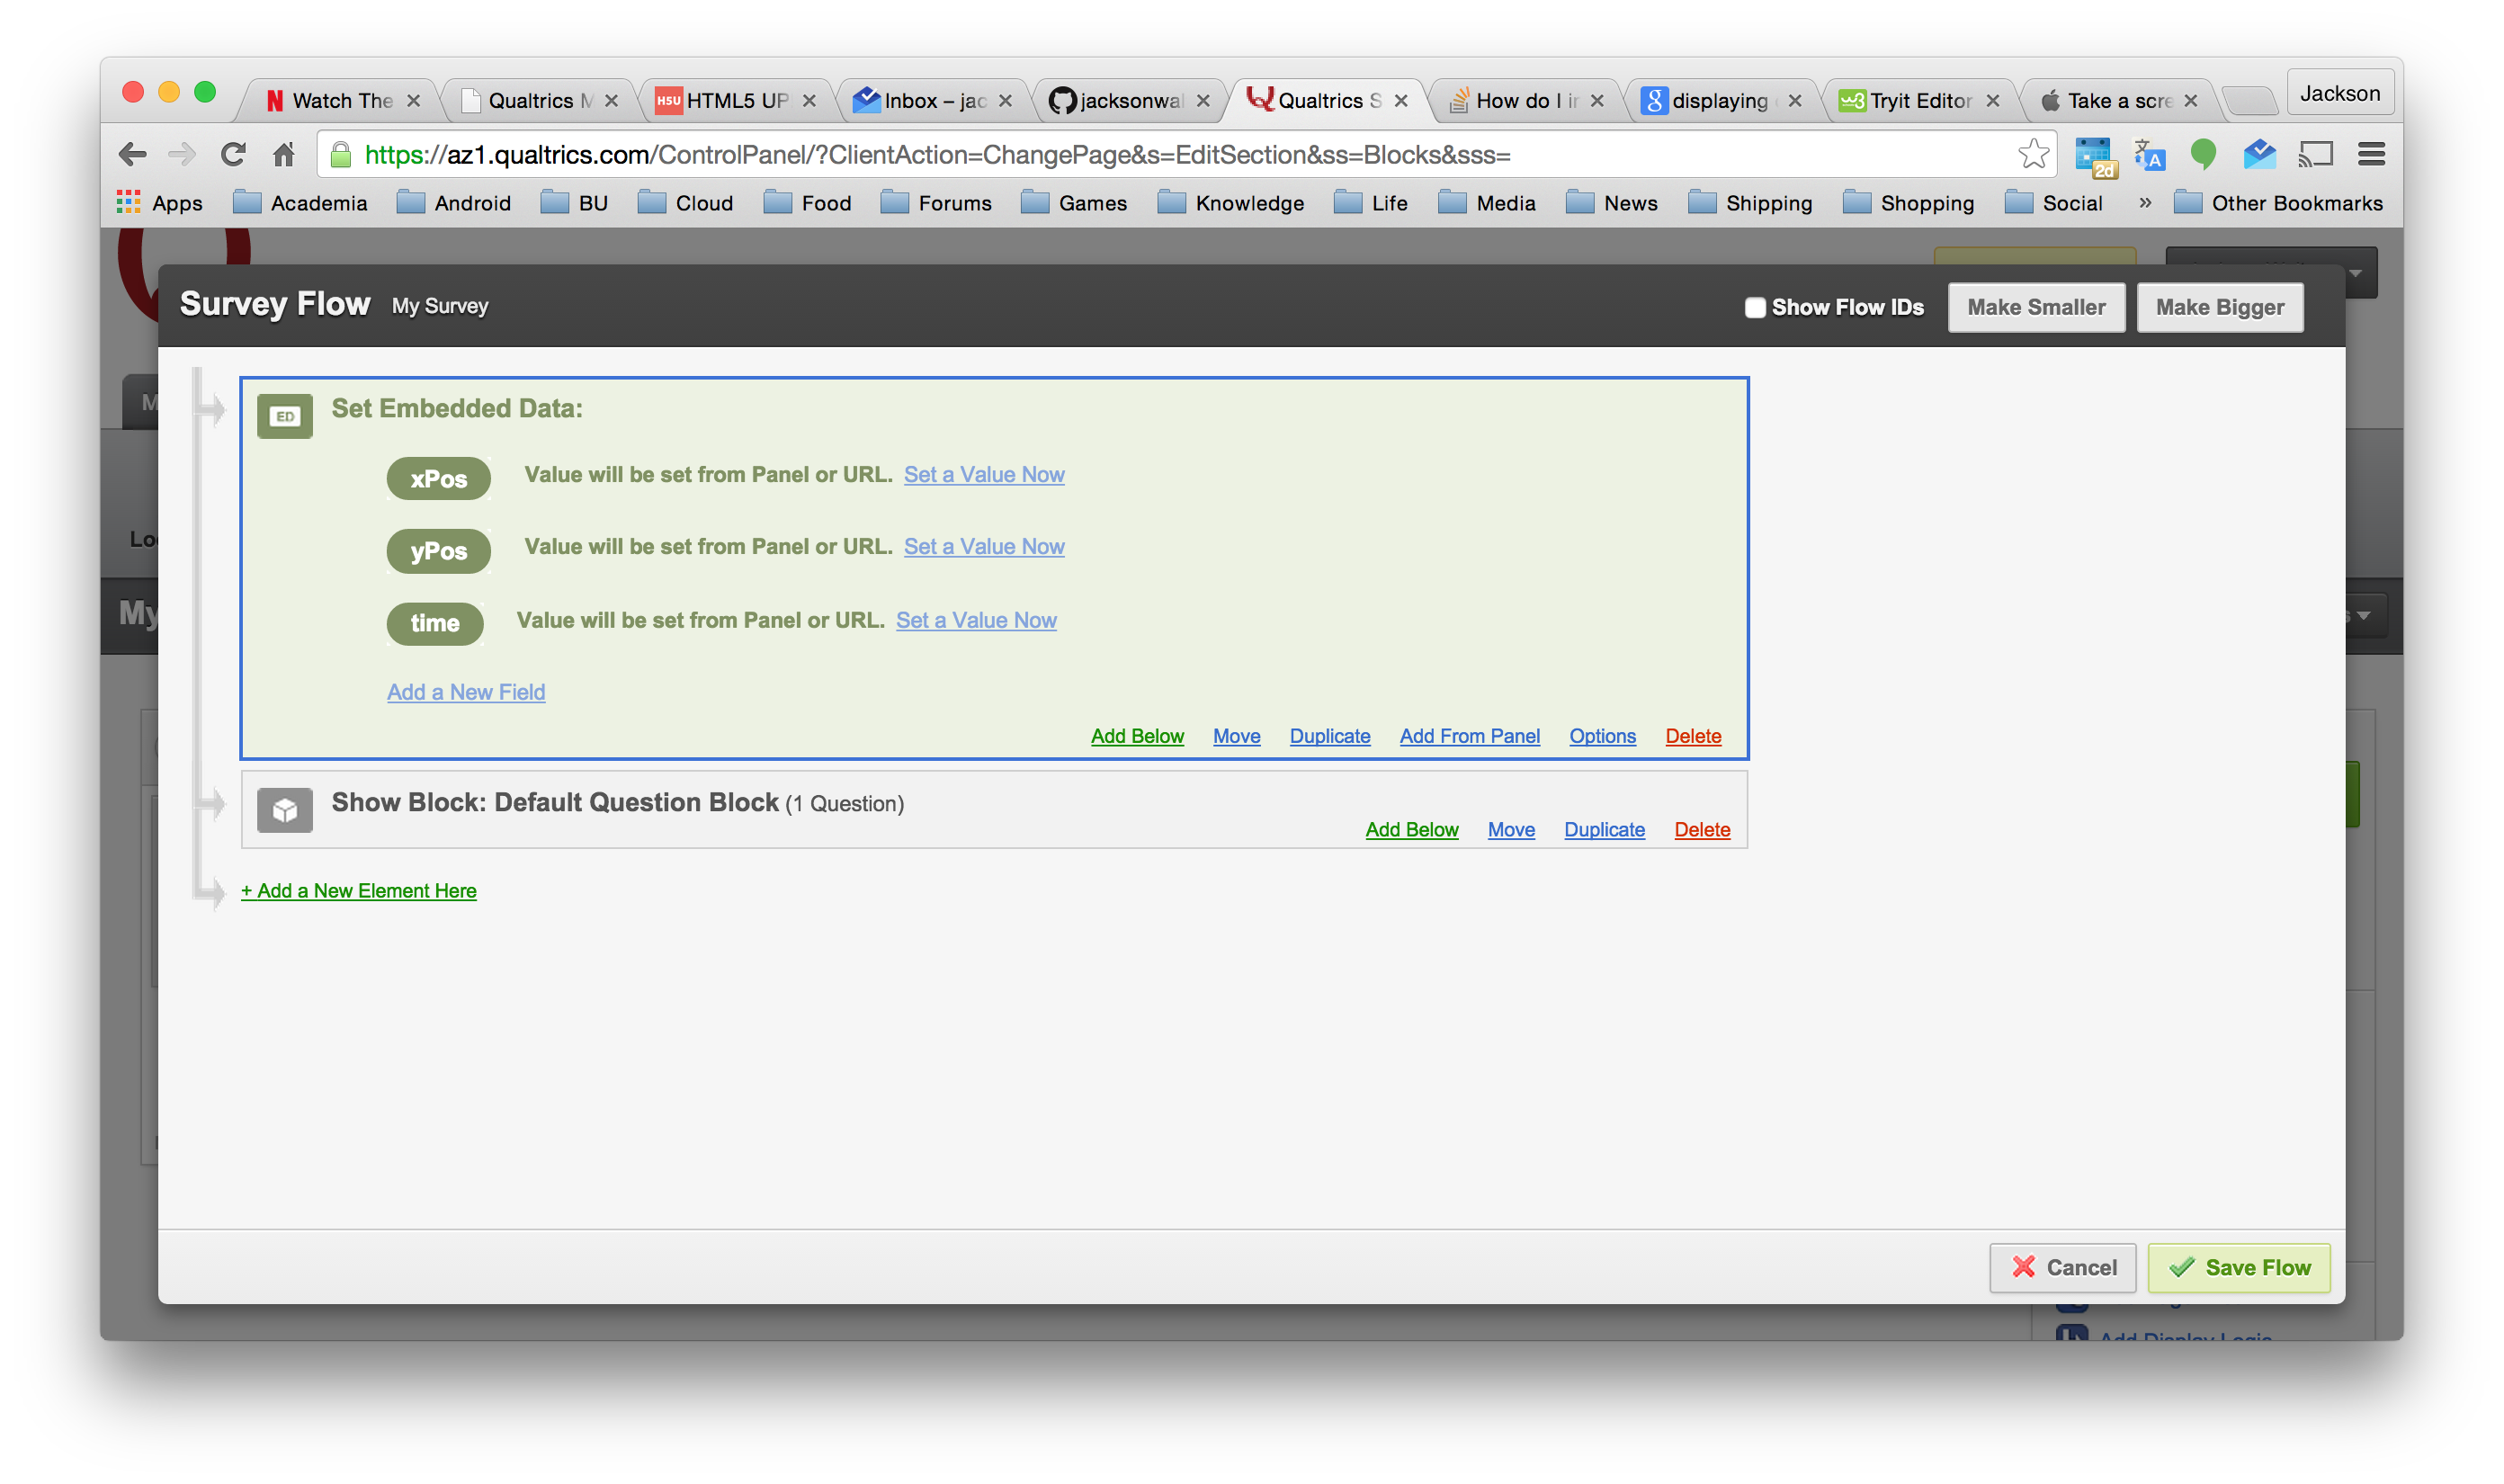
After creating the survey, click on 'Survey Flow' under the 'Edit Survey' tab. Hit 'Add a New Element Here', choose 'Embedded Data', and add three fields: 'xPos', 'yPos', and 'time'. Then click and hold 'Move' and drag the embedded data block to the top of the flow. Make sure to hit save when you're done.
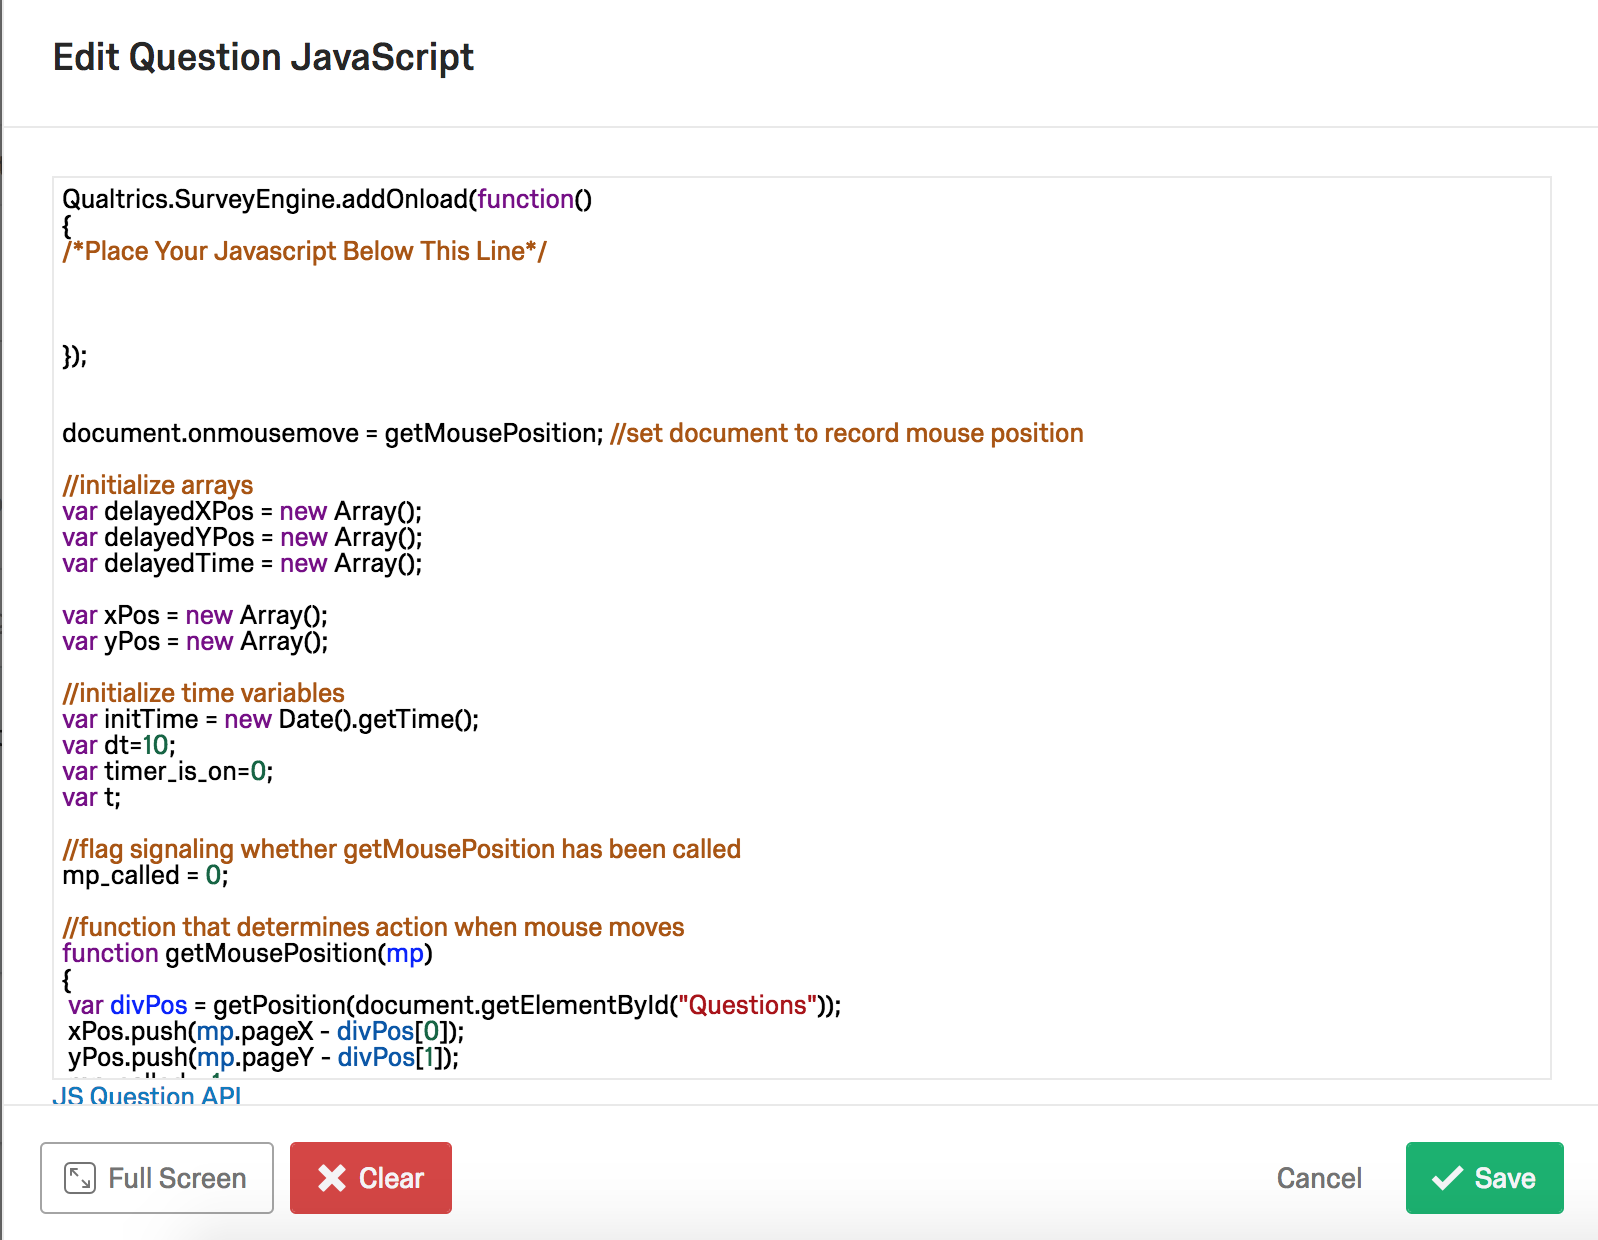
Next we want to set up a question for mouse tracking (this implementation is only set up to work for one question, but could be modified). Click on the orange 'JS' box to add javascript. Then insert the following chunk of code after the 'addOnLoad' already present:
document.onmousemove = getMousePosition; //set document to record mouse position

//initialize arrays
var delayedXPos = new Array();
var delayedYPos = new Array();
var delayedTime = new Array();

var xPos = new Array();
var yPos = new Array();

//initialize time variables
var initTime = new Date().getTime();
var timer_is_on=0;
var t;

//time interval for data collection in ms
var dt=10;

//flag signaling whether getMousePosition has been called
mp_called = 0;

//function that determines action when mouse moves
function getMousePosition(mp)
{
 var divPos = getPosition(document.getElementById("Questions"));
 xPos.push(mp.pageX - divPos[0]);
 yPos.push(mp.pageY - divPos[1]);
 mp_called = 1;
 return true;
}

function timedCount()
{
 if(mp_called){
   delayedXPos.push(xPos[xPos.length-1]);
   delayedYPos.push(yPos[yPos.length-1]);
   var timeInSec = (new Date().getTime()-initTime) / 1000.;
   delayedTime.push(timeInSec);
  }
  t=setTimeout("timedCount()",dt);
}

function doTimer()
{
 if (!timer_is_on)
 {
  initTime = new Date().getTime();
  timer_is_on=1;
  timedCount();
 }
}

function getPosition(obj){

var topValue= 0,leftValue= 0;

while(obj)
{
 leftValue+= obj.offsetLeft;
 topValue+= obj.offsetTop;
 obj= obj.offsetParent;
}

return [leftValue, topValue];
}

//start collecting data after page loads
document.onload = doTimer();
It should look like this:
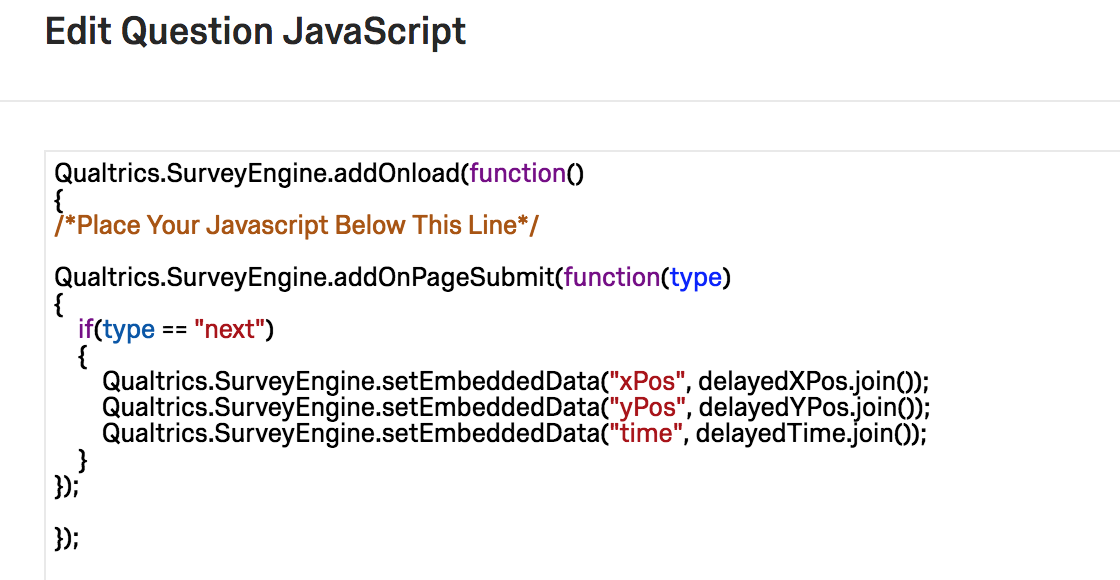
The last step is to tell Qualtrics what to do when the 'Next Button' is clicked. We want to store the data for xPos, yPos, and time in our embedded data variables. Note: Qualtrics changes their API somewhat frequently. At present (Feb. 2018) the way to do this is using the Qualtrics.SurveyEngine.addOnPageSubmit function with type 'next'.
Within the addOnLoad function, add the following code:
Qualtrics.SurveyEngine.addOnPageSubmit(function(type)
{
	if(type == "next")
	{
		Qualtrics.SurveyEngine.setEmbeddedData("xPos", delayedXPos.join());
  		Qualtrics.SurveyEngine.setEmbeddedData("yPos", delayedYPos.join());
  		Qualtrics.SurveyEngine.setEmbeddedData("time", delayedTime.join());
	}
});
It should look like this:
Save the Javascript and that's it! Under this implementation the mouse tracking will begin as soon as the user reaches the given question. The first recorded event corresponds to the first time the user moves their mouse. The position of the user's mouse and the time since the user reached the question will then be recorded every dt ms (in this case 10, but can easily be changed) until the user hits the 'Next Button' we inserted. The position on the page corresponding to the point (x,y)=(0,0) (the origin) is the top left corner of the 'Questions' div.
Retrieving the Data
Finally we'll want to retrieve the data. The list of x, y positions and time will be stored as strings in the embedded data variables xPos, yPos, and time.
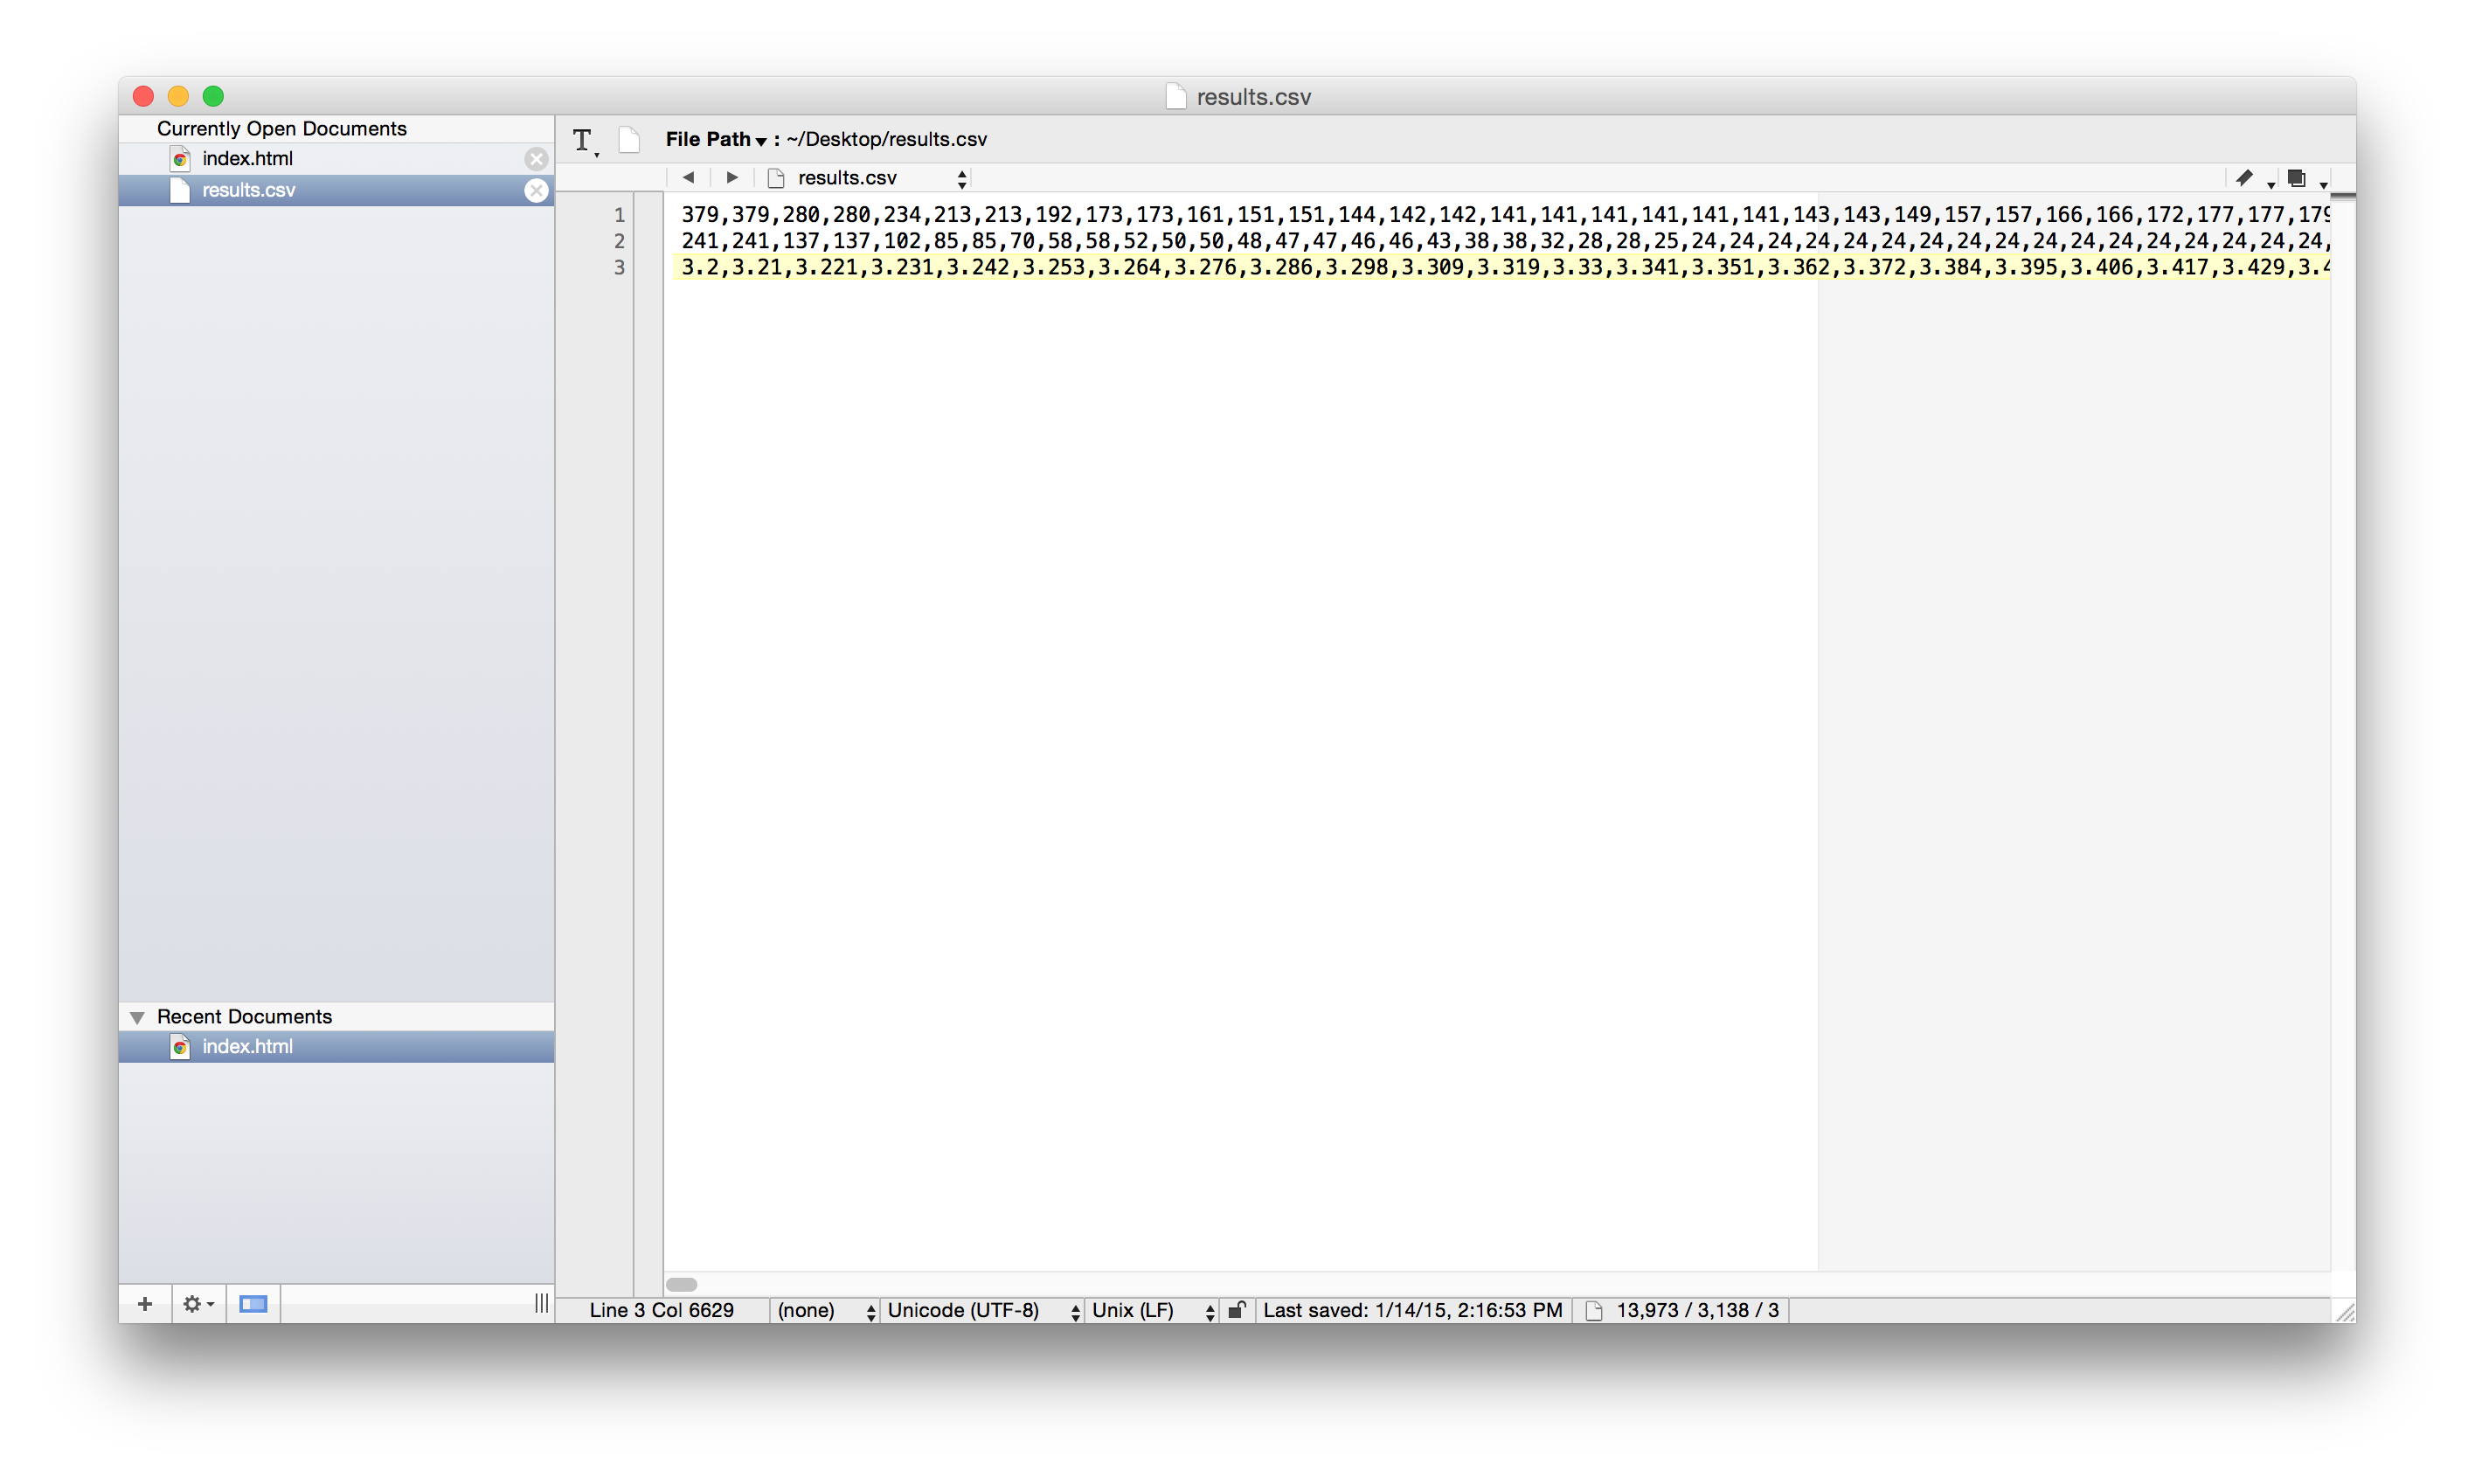
After activating, launching, and completing your survey at least once to get some data, click on the Data Analysis tab and export the data as a .csv file. The results should look like the image below. If the xPos, yPos, and time cells are blank something is wrong.
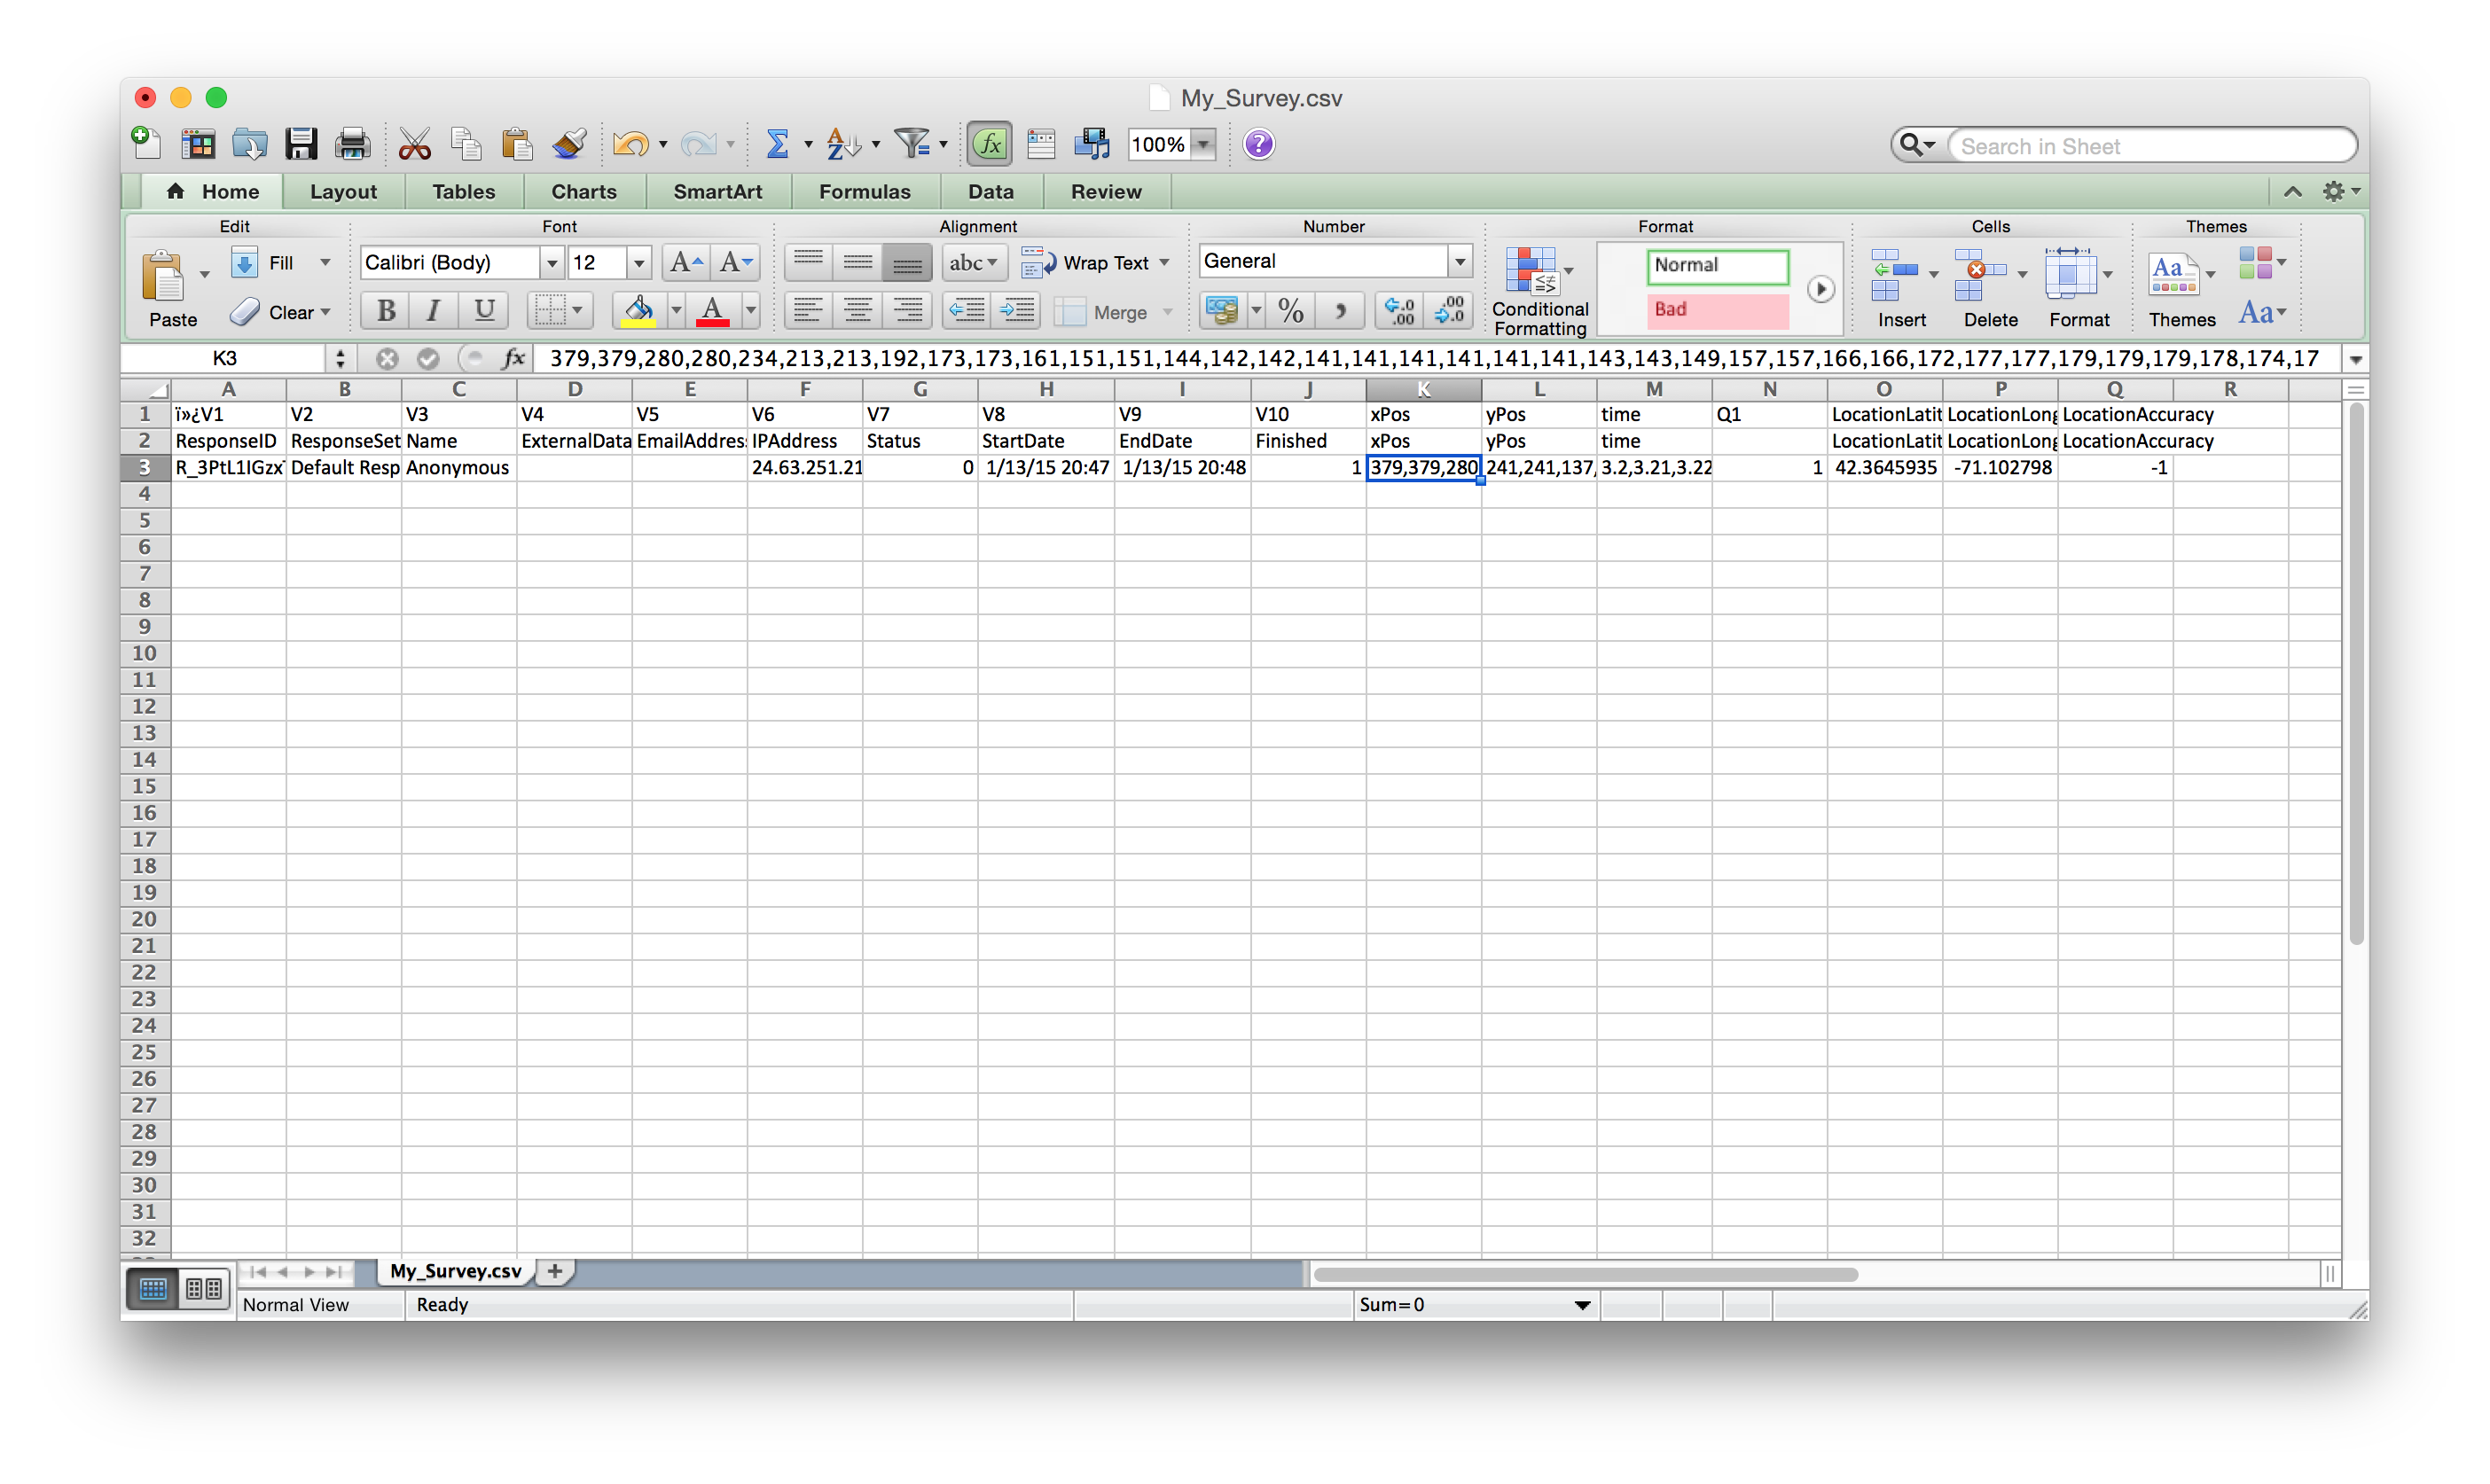
The results will be stored under the xPos, yPos, and time columns, each as a single comma separated string. We want to separate the strings into lists of distinct numbers. To do this, create a separate .csv file and open it in a text editor. Copy and paste each string from the original CSV file as a single line in the new one. You may now save this file and reopen it in Excel or wherever to view or manipulate the data as you desire.
I used Mathematica (simple_process.nb) to do some post processing. Here are some examples of results you can expect:
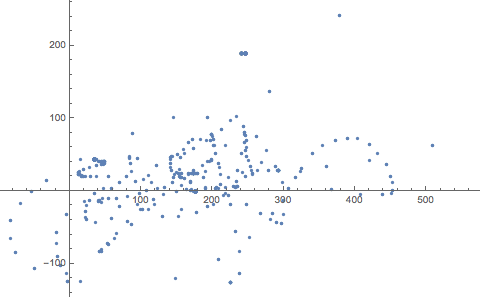
Above is a plot of all (x,y) points for some sample data. Using the time data, I created a short animation that gives a better idea of what is happening:
That should do it! I hope this helps someone out there. Please note that a lot of this could be modified to suit your particular needs - this is just the simplest, most general implementation.