MA 415/615 Spring 2025
MA 415/615 Data Science in R
Introduction to R, the computer language written by and for statisticians. Emphasis on data exploration, statistical analysis, problem solving, reproducibility, and multimedia delivery. Effective Fall 2020, this course fulfills a single unit in the following BU Hub area: Critical Thinking.
Tentative Syllabus
Logistics
- Lectures MWF 2:30 PM - 3:20 PM
- EPC 205
- Discussion Section
- Section A2 W 3:35 PM - 4:25 PM
- Section A3 W 4:40 PM - 5:30 PM
Instructors
Prof. Daniel Sussman
Office hours:
- MW 11:00 AM - 1:00 PM
TF Aislinn Sullivan
<aislinns@bu.edu>
Office hours:
- Tue 5:00 PM - 6:00 PM
Location: CDS 346
Description
Data Science can be described as an amalgamation of many different fields concerned with the analysis of large, varied, and rich datasets. For this reason, it has gathered interest from many domain specific disciplines and acquired a stronger computational focus. The goal of this course is to provide an introduction to Data Science that covers the most typical analyses, including data wrangling — cleaning and tidying — exploratory data analysis (EDA), data visualizations, modelling, and, effective communication of results.

To perform these tasks, we will be using R, a programming language specially geared to data analysis, with a broad collection of specialized packages (add-ins), and its most popular interface, RStudio. Because students develop many written products, including code and documentation, we also cover a version control system called Git.
::: column-margin R is open source and can be found at R project. R’s official package repository is CRAN. RStudio has an open source version and is developed by its namesake company; check for a free version at RStudio.com. :::
This course promotes a hands-on approach where students practice concepts during lecture and discussion sessions, and work on the delivery of finalized products covering data analysis, presentations, and reproducible research. Students are evaluated based on homework assignments, in-class activities, group blog posts, and the final group project.
Antiracism
The content and assessments for this have been modified as part of Boston University’s Designing Antiracist Curricula Fellowship which Professor Sussman participated in during its inaugural year, 2022-2023. The class will feature data sets and analyses that will illustrate systemic racism and the historical impact of data science and statistics on racist ideas and policies. As a results, we may be discussing sensitive topics that can evoke strong feelings. The class will develop a Community Agreement to facilitate these discussions and ensure outlets for students to bring up difficulties they encounter. We will also study best practices for practicing equitable data science. For the final project, students will find data and ask and address questions with antiracist and social justice themes.
Learning Outcomes
Following the end of the course, students will be able to
- Use R and the tidyverse to import, tidy, transform, visualize, and model data.
- Study documentation and find online resources to learn new data science tools.
- Communicate findings of a data analysis to diverse audiences.
- Explain data about racial inequality through visualizations, charts, and descriptive statistics.
- Understand that many data can be used to promote both racist and antiracist conclusions.
- Apply tools and confront the challenges in “correcting/adjusting” for race and other variables.
- Explain and apply principals for equitable data practices.
Prerequisites
Basic programming (at the level of CS 111) and basic statistics and probability (at the level of MA 113/115/213).
Topics
The course is roughly divided in three parts: weeks 1–4 cover data exploring, weeks 5–8 are about data wrangling, in weeks 8–13 we discuss modeling and special topics.
Textbook
We adopt the following reference for most of the course.
::: column-margin

- Garrett Grolemund and Hadley Wickham1. R for Data Science (R4DS). O’Reilly Media. Second edition.
The later topics in the course are covered from class notes and selected readings. The textbook contains many other references that cover from more basic concepts to more advanced methods. We also recommend the (short) exercises in R4DS as a way to practice the concepts in smaller chunks. Moreover, the R community is very active and provides documentation, working examples of package applications, and online discussions.
- For a more hands-on introduction to R and for students wanting a refresher on basic programming, I recommend Hands-On Programming with R by Garrett Grolemund. HOPR is also available online.
- For more background on Statistics, see Introduction to Modern Statistics. In particular, the labs, are an excellent resource for seeing statistics in action in R. Use the “R (tidyverse)” versions when available.
Course Evaluation
CAS MA 415 and GRS MA 615 meet concurrently, have the same requirements, and are graded identically.
This course is very hands-on, so evaluation will be based on homework assignments, blog posts, in-class activities, and a final project. Homework assignments are individual, following on classroom work, and focus on coding, data analysis, and documentation explaining all the work. After a few weeks, you’ll begin work on your final project and at that point you and your team will be responsible for writing weekly blog posts on your progress.
Homework
For homework assignments we provide templates that are to be filled as the students learn to write code and documentation and to control versions. However, less scaffolding is offered as the semester progresses.
Homework will be due approximately weekly and graded for the following week. Each problem will be graded on the EMRN rubric as detailed in this image.
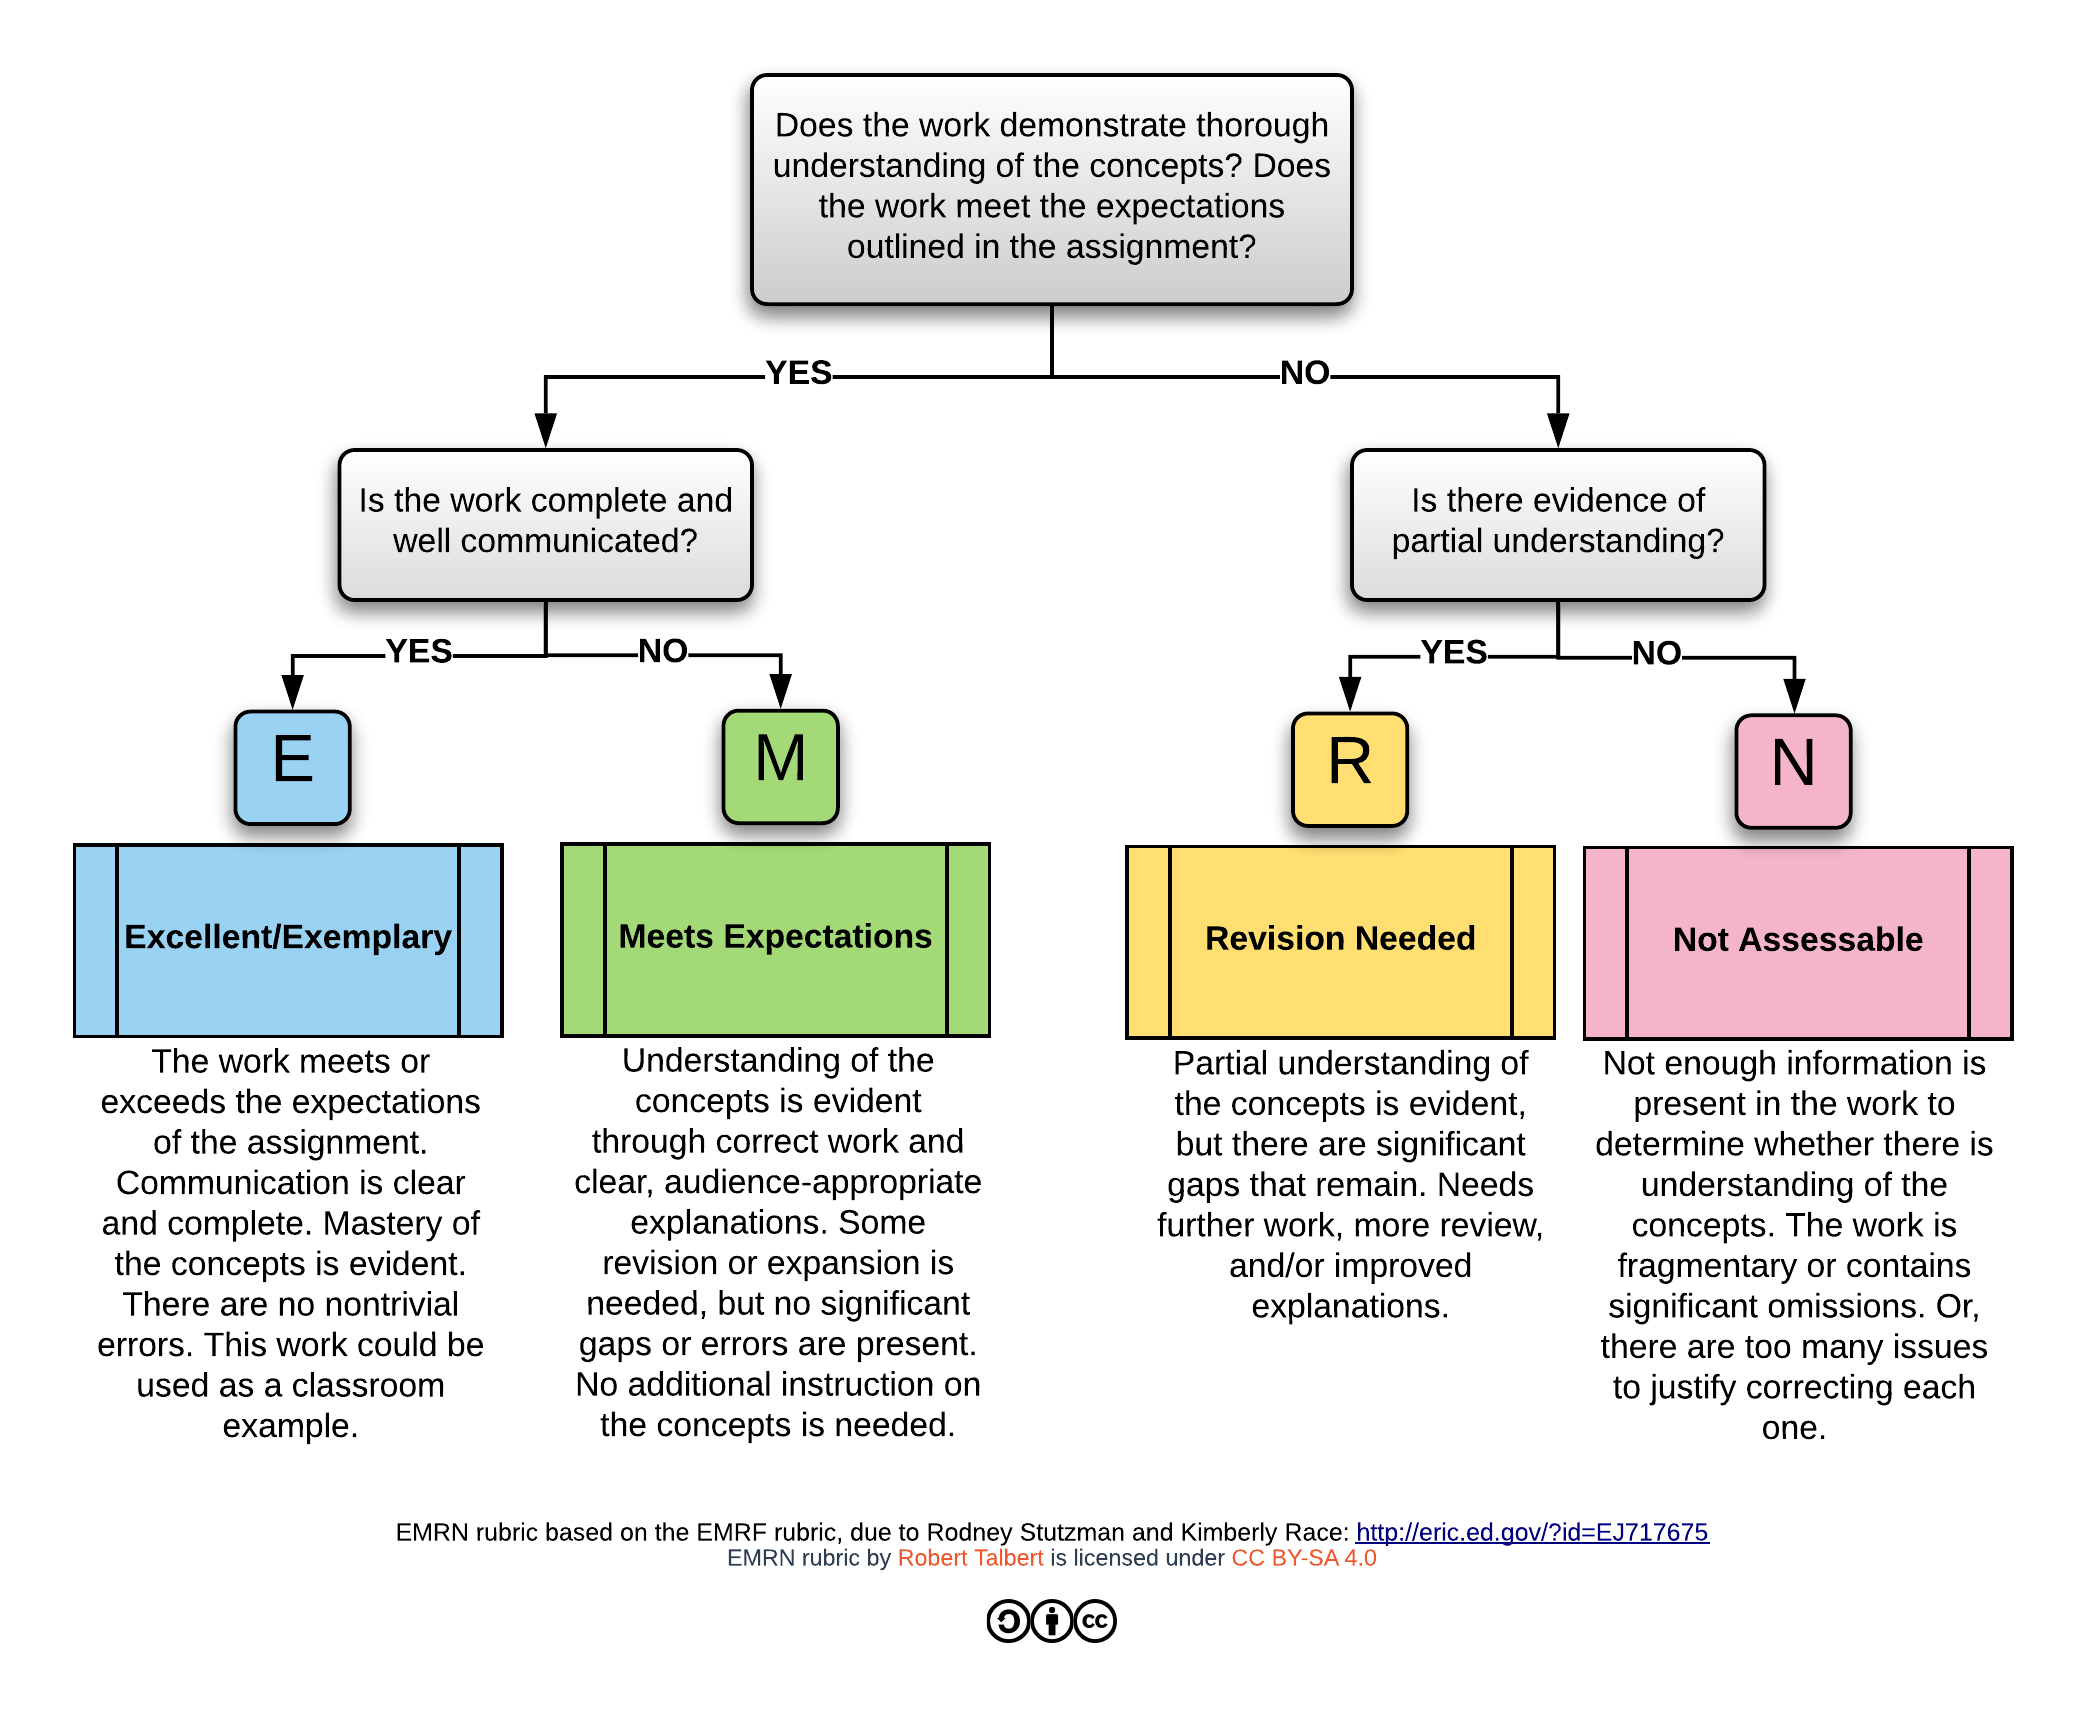
Your numerical score for each HW will be based on the number of Es, Ms, Rs, and Ns you earn for each HW. Specifically, an E will be worth 30 pts, an M will be worth 20 pts, an R will be work 5 pts, and an N will be worth 0 pts. Each HW will consist of 4 problems but the maximum points you can earn is 100. (Note, 2 Es and 2 Ms earns a perfect score.) There is no extra credit for HW.
HW will be due at the due date but you will have the ability to turn in a revision of your HW after it has been graded if you would like to earn a higher grade. You will have one opportunity to revise each HW and your revision must be turned in at most 2 weeks after you receive your grades (or one week before the final project due date, whichever is sooner).
Submitting assignments with Github
All assignments are submitted exclusively through Github.
To do so, follow these steps:
- Render (making sure there are no errors and looking over the preview).
- Stage (all the files including images, making sure there is a check next to each file)
- Commit (with a message)
- Push
- Verify (Go to the repo on Github and check your
hw#.mdfile. If it looks wrong, check again for errors in your rendering and go back to step 1.)
The details for these steps will be covered in class.
In class Activities
We will often have in-class activities and to evaluate these activities, I will often post a link on Teams to a Google Form to fill out. These forms are required and represent 15% of the final grade. However, these forms are only graded for completion/submission, so as long as you submit them by the deadline you get full credit. You are also allowed to miss 3 forms over the course of the semester with no penalty.
Final Project
The final project integrates the main topics in the course and consists of a more significant, realistic data analysis project. It should be comprehensive, from data scraping, wrangling, visualizing, summarizing to a consistent deliverable. The project should, in summary, answer a relevant question of interest with data storytelling.
Students will tackle the project in teams, to exercise collaborative work. All team members are expected to contribute equally to the completion of each report and project. During the final week of the course, we will have a Project Expo where teams will share their work and provide feedback on other teams work.
The deadline for the Final project is the date and time the final exam for the course would be scheduled for if the course had a final.
Grading
Homework assignments represent 30% of the final grade, blog posts represent 15%, in-class activities represent 15%, and the final project covers the remaining 40% of the course grade. Homework with the lowest score for each student will be dropped when computing homework grades.
Communication
- Please refer to Microsoft Teams for course materials.
- Grades are on Blackboard but grade feedback (and other feedback) will be on Github.
- Nearly all communication will be over Teams.
- Consider asking questions in one of the relevant channels because it is likely other students have the same question.
- In order to keep things organized, make sure to make posts in a relevant channel.
- Also, post in the thread corresponding to a given lecture or assignment if the question is specific to that assignment.
- If you need to contact the instructor privately, you can do so using the Direct Message feature of Teams.
- Please communicate with the instructors if you anticipate that you will unable attend class meetings or complete assignments on time.
Policies
Participation
In this course class time—either in lecture or discussion—is designed to be as interactive as possible. The reasoning is that, like Math, one can only really learn programming by practicing, so we provide as many activities as possible. We also encourage participation in class, especially when helping fellow students!
Attendance
While not required, attendance is strongly encouraged and is crucial for successful performance of group assigments.
Late work
Late homeworks and assignments will only be accepted up to 24 hours after their deadline but will carry a -20% penalty. Later homeworks and blog posts and late final projects will not be accepted.
Diversity and Inclusiveness
We welcome students from diverse backgrounds, perspectives, experiences, and identities—including gender identity, sexuality, disability, age, socioeconomic status, ethnicity, religion, and culture. We intend to serve well all students in this course, to address learning needs, to present materials that are respectful of diversity, and to foster an inclusive learning environment by sharing the view that diversity brings strengths and benefits.
Academic Conduct
Your conduct in this course, as with all BU courses, is governed by the BU Academic Conduct Code. Graduate students should observe the Graduate School (GRS) Conduct Code. In particular,
- Students should not share code with other student in individual assignments or with other teams in team assignments. Students are, however, welcome to discuss problems together and ask for advice.
- Any code or argument based on online resources, including StackOverflow, should be acknowledged and referenced. Otherwise, assignments containing uncited material will be treated as plagiarism2.
- We will also follow the CDS Generative AI Assistance (GAIA) Policy.
- Cheating on exams or plagiarism on assignments, lying about an illness or absence and other forms of academic dishonesty are a breach of trust with classmates and faculty, violate the Conduct Code, and will not be tolerated.