

Figure 1. Time series for

 2 The Mandelbrot Set (Next Section)
 Fractal Geometry of the Mandelbrot Set (Cover Page)
 Fractal Geometry of the Mandelbrot Set (Previous Section)
 BU Math Home Page
The Mandelbrot set is generated by iteration. Iteration means to repeat a process over and over again. In mathematics this process is most often the application of a mathematical function. For the Mandelbrot set, the function involved is the simplest nonlinear function imaginable, namely x2 + c, where c is a constant. As we go along, we will specify exactly what value c takes.
To iterate x2 + c, we begin with a seed for the iteration. This is a (real or complex) number which we denote by x0. Applying the function x2 + c to x0 yields the new number
x1 = (x0)2 + c
and so forth. The list of numbers x0, x1, x2,... generated by this iteration has a name: It is called the orbit of x0 under iteration of x2 + c. One of the principal questions in this area of mathematics is: What is the fate of typical orbits? Do they converge or diverge? Do they cycle or behave erratically? In a real sense, the Mandelbrot set is a geometric version of the answer to this question.
Let's begin with a few examples. Suppose we start with the constant c = 1. Then, if we choose the seed 0, the orbit is
and we see that this orbit tends to infinity.
As another example, for c = 0, the orbit of the seed 0 is quite different: this orbit remains fixed for all iterations.
If we now choose c = -1, something else happens. For the seed 0, the orbit is
Here we see that the orbit bounces back and forth between 0 and -1, a cycle of period 2.
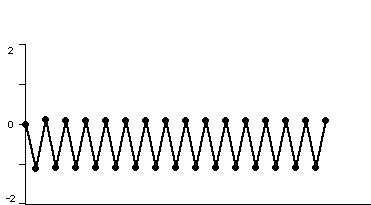
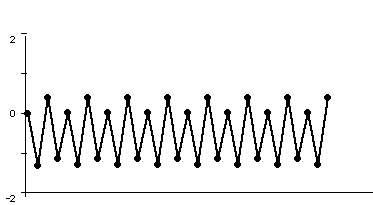
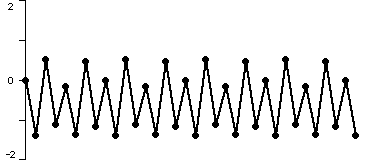
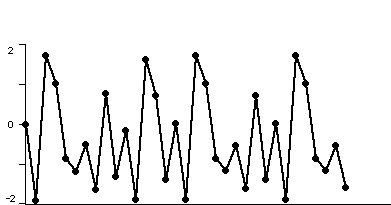
To understand the fate of orbits, it is most often easiest to proceed geometrically. Accordingly, a time series plot of the orbit often gives more information about the fate of the orbits. In the plots below, we have displayed the time series for x2 + c where c = -1.1, -1.3, -1.38, and 1.9. In each case we have computed the orbit of 0. Note that the fate of the orbit changes with c. For c = -1.1, we see that the orbit approaches a 2-cycle. For c = -1.3, the orbit tends to a 4-cycle. For c = -1.38, we see an 8-cycle. And when c = -1.9, there is no apparent pattern for the orbit; mathematicians use the word chaos for this phenomenon. To see this in another light, we have plotted a histogram of the first 20,000 points on the orbit of 0 under x2 - 1.9 in Figure 2. In this picture we have subdivided the interval [-2, 2] into 400 subintervals. The histogram was incremented by one unit each time the orbit entered one of these subintevals.


Figure 1. Time series for 

Figure 2. Histogram of the orbit of 0 under 
To see additional time series plots for other values of c, select a c value from the options below:
Before proceeding, let us make a seemingly obvious and uninspiring observation. Under iteration of x2 + c , either the orbit of 0 goes to infinity, or it does not. When the orbit does not go to infinity, it may behave in a variety of ways. It may be fixed or cyclic or behave chaotically, but the fundamental observation is that there is a dichotomy: sometimes the orbit goes to infinity, other times, it does not. The Mandelbrot set is a picture of precisely this dichotomy in the special case where 0 is used as the seed. Thus the Mandelbrot set is a record of the fate of the orbit of 0 under iteration of x2 + c.
How then is the Mandelbrot set a planar picture? The answer is, instead of considering real values of c, we also allow c to be a complex number. For example, the orbit of 0 under x2 + i is given by
and we see that this orbit eventually cycles with period 2. If we change c to 2i, then the orbit behaves very differently
and we see that this orbit tends to infinity in the complex plane (the numbers comprising the orbit recede further and further from the origin). Again we make the fundamental observation either the orbit of 0 under x2 + c tends to infinity, or it does not.
 2 The Mandelbrot Set (Next Section)
 Fractal Geometry of the Mandelbrot Set
(Cover Page)
 Fractal Geometry of the
Mandelbrot Set (Previous Section)
 BU Math Home Page